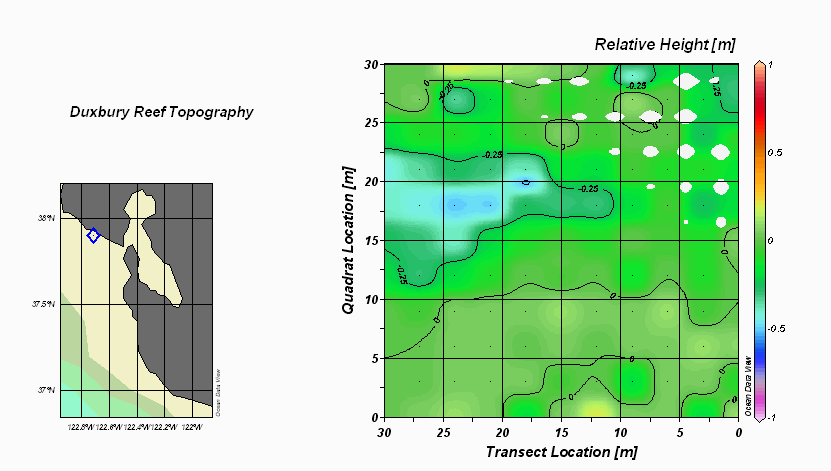
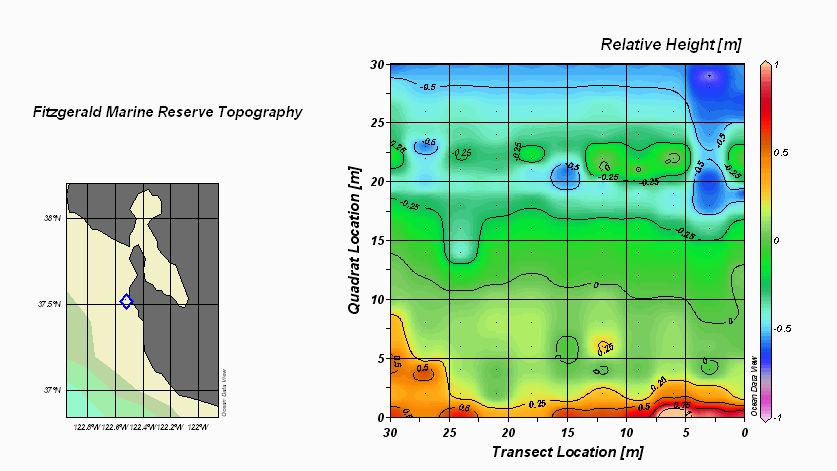
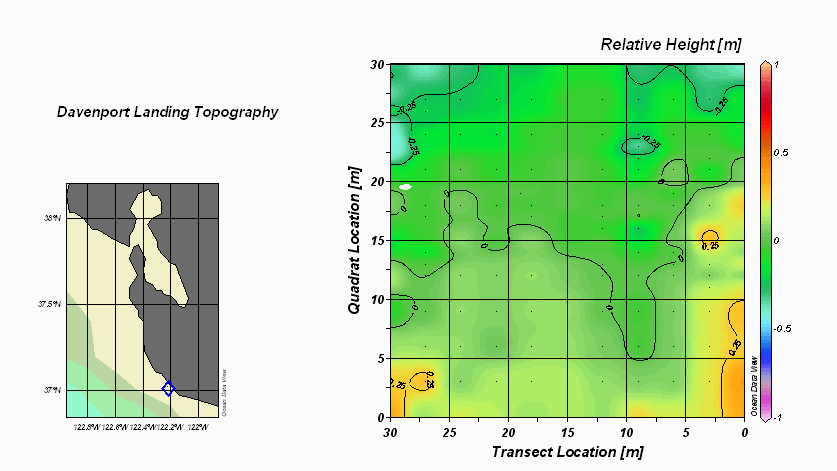
The 3-dimensional graphs show the relative topographies of the study sites. The Northeast corner of the plot is labeled (0,0) with quadrat locations (distance along transect) increasing towards the ocean.
As shown in the figures, the topographies of the three study plots show significant differences. Although all tend to slope downward toward the ocean, the Davenport Landing plot is much flatter than the survey plots at the other sites. In addition, there is a deep crevice running across the plot at Fitzgerald, and Duxbury Reef shows a shallow flood channel in the middle.
Three-dimensional profiles
| Duxbury Reef |  |
| Fitzgerald Marine Reserve |  |
| Davenport Landing |  < < |
Contour plots


Note: Contour plots on this page were created using Microsoft Excel and Ocean Data View Software [1].
References
- Schlitzer, R., Ocean Data View, http://odv.awi.de/, 2005.
