| Survey results are not yet complete for the 2005 survey |
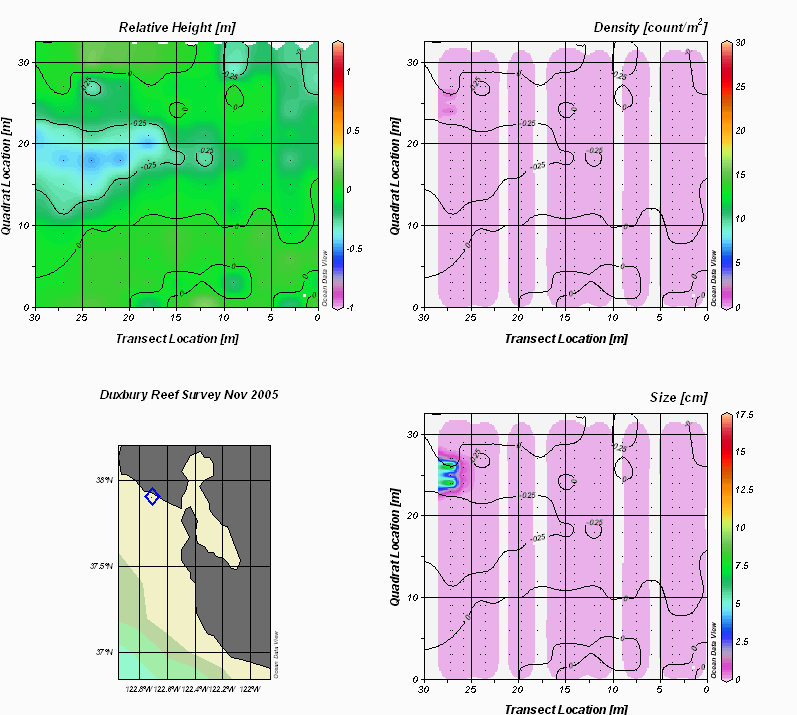
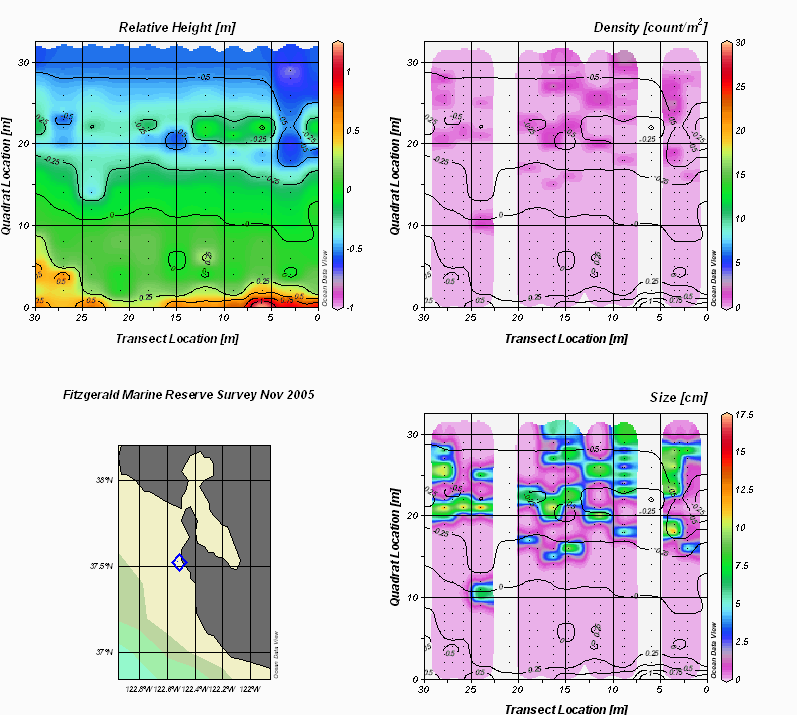
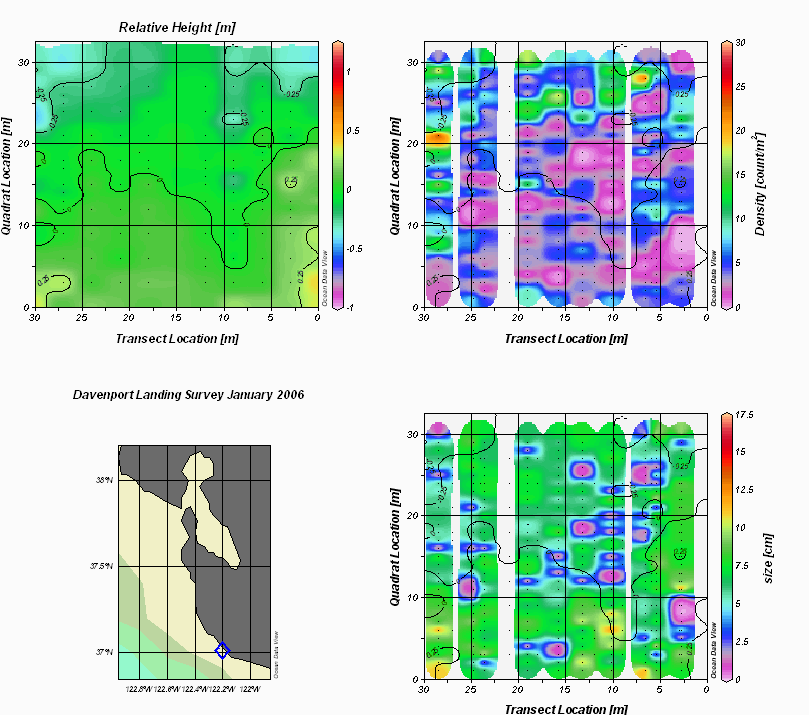
These diagrams show the detailed baseline distributions of topography (ground height relative to center of plot), abundance (density in counts/m2), and size (cm) within each of the surveyed plots. Note that the values have been averaged across the samples measured by using a variable spaced grid [1]. Gaps are present because of randomized sampling. Each plot shows contour lines representing the topography of the site. A map showing the location of the site is also shown in the diagrams.
Duxbury Reef

Fitzgerald Marine Reserve

Davenport Landing

Abundance distribution at Davenport Landing and Fitzgerald Marine Reserve
Abundance as a function of intertidal distance
Size distribution at Davenport Landing and Fitzgerald Marine Reserve
Temperature comparison at the three sites (error bars represent ±1 standard deviation)
Temperature relation with Tide height
| References |
- Schlitzer, R., Ocean Data View, http://odv.awi.de/, 2005.
